1. Introduction
There are various shock phenomena in the production, transportation and operation in various industries such as aviation, aerospace, navigation, weapons, and electronics, which have a great negative impact on the quality and reliability of the products. In order to solve this problem, a shock test was produced and developed on this basis. After more than one hundred years of development, the shock test technology has become quite mature, and it also plays an irreplaceable role in national defense and civil industries.
However, the traditional shock test (also known as the classic shock test) mainly simulates the actual shock environment by the shock effect produced by a simple pulse. This method has great limitations; there is a trend to be replaced by shock response spectrum (SRS) standard test.

2. Reasons and advantages of shock response spectrum instead of classic shock
1) The purpose of studying shock is not to study the shock waveform itself, but to pay more attention to the effect of shock on the shock response spectrum testing equipment, or to study the damage potential of the impact motion to the system. It is difficult and inaccurate to describe the damage potential with the time history of the shock, and sometimes leads to wrong conclusions. But the shock response spectrum specification can avoid such errors;
2) The classic shock specification strictly specifies the type of pulse, while the shock response spectrum specification does not make strict requirements on the type of shock pulse and the method of generating shock, so it has greater flexibility on experiments;
3) The shock response spectrum simulation is closer to the actual shock environment than the specified shock pulse waveform simulation;
4) For the engineering designer, through the analysis of the shock response spectrum, the maximum dynamic load of each part of the equipment can be more accurately calculated, thereby predicting the potential damage of the shock; at the same time, it can also provide a more flexible test technique to ensure the repeatability of the shock and vibration test.
3. Example: The difference between the two shock specifications
Example: Figure 1(a) shows two half-sine pulses with the same area but different waveforms (their speed changes are equal), (b) shows two same half-sine pulses but one of them is superimposed with one extremely narrow pulse. From the time history alone, it is difficult to draw the difference between the two groups. Figure 2 shows the shock response spectrum curves of the two sets of curves.
It can be seen from comparison that shock pulse A is more damaging to high-frequency systems, while B has a greater damage potential to low-frequency systems; although pulse C and pulse D have a large difference in time history peaks, it is easy to know that they are very high frequency by their shock spectrum curves. The damage potential of the two outside is the same. It can be seen that shock response spectrum specification can better describe the damage potential of the system.

Figure1 Comparison of shock waveforms

Figure2 Shock response spectrum corresponding to Figure 1
4. Definition of shock response spectrum
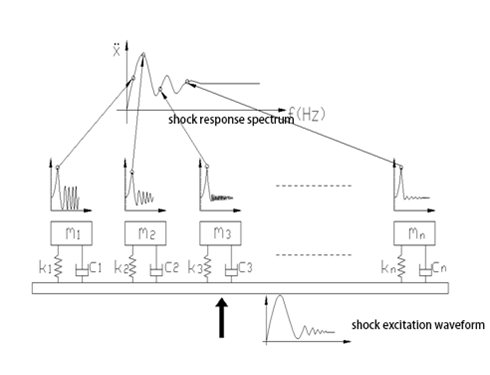
The shock response spectrum refers to a series of single-degree-of-freedom mass damping systems. When the public foundation is subjected to shock excitation, the response peak of each single-degree-of-freedom system is drawn as a function of the natural frequency of the single-degree-of-freedom system. Simply put, it is a curve drawn by taking the natural frequency of a single degree of freedom system as the abscissa and the response peak value as the ordinate under the Cartesian coordinate system.
An actual physical system can be decomposed into a number of different single-degree-of-freedom systems. For each SDOF system, the shock response analysis and calculation are performed, and the maximum value of the system response is taken, and then a data point is formed with its natural frequency. In this way, how many sets of data points can be obtained as many SDOF systems can be decomposed into? Finally, these points are combined to get the shock response spectrum of the entire system. The principle is shown in Figure 3.

Figure 3 The actual physical system is divided into several single degree of freedom system physical models
5. Application of shock response spectrum
1) Used as a measure of the impact effect. Because most systems and structures can be characterized by SDOF systems, even complex equipment or structures can also use dominant frequency (that is, the frequency corresponding to the maximum value on the spectral density curve) or analog frequency (that is, how many cycles per second, unit Hz), so the shock response spectrum can be used to easily determine the response peak of the structure under shock, and draw a conclusion whether it will be damaged;
2) For statistical analysis of shock events, a reliable specification spectrum representing the shock environment can be obtained;
3) Used for equivalent conversion of different shock waveforms, such as converting actual complex shocks into half-sine pulses with equivalent damage potential;
4) Used for test validity and repeatability check;
5) It is used to guide the design of shock-bearing systems.
6. Example: Product actual shock environment and SRS
Example 2: Assuming that the product is subjected to a complex oscillation type shock during transportation, the following figure 4(a) is an intercepted shock waveform, after response spectrum analysis, obtained shock response spectrum as shown in figure 4(b). The product contains different parts, each part has different natural frequencies, corresponding to different response peaks, from which it is easy to determine which parts' response peaks exceed the damage allowable value, and draw a conclusion whether it will be damaged.

Figure 4 The actual shock environment of the product and its shock response spectrum